Amazon went from an online bookstore to one of the most valuable brands in the world, selling pretty much every product imaginable. It’s no secret how much the marketplace pays off to Jeff Bezos, but what about sellers? Is Amazon still the king, or should you, as a web retailer, seek out alternative routes to reach your customers?
In this article, we’ll share with you some of the most interesting, up-to-date stats about Amazon that will help you better understand the state of Amazon and its effect on online sellers today. Let’s jump into it.
Amazon Stats You Need to Know
Amazon Is the Third-Most Valuable Brand in the World And It Keeps Rising
As of 2022, only Apple and Google managed to beat Amazon in terms of value. The online marketplace managed to leave behind the likes of Microsoft and Facebook (now Meta).
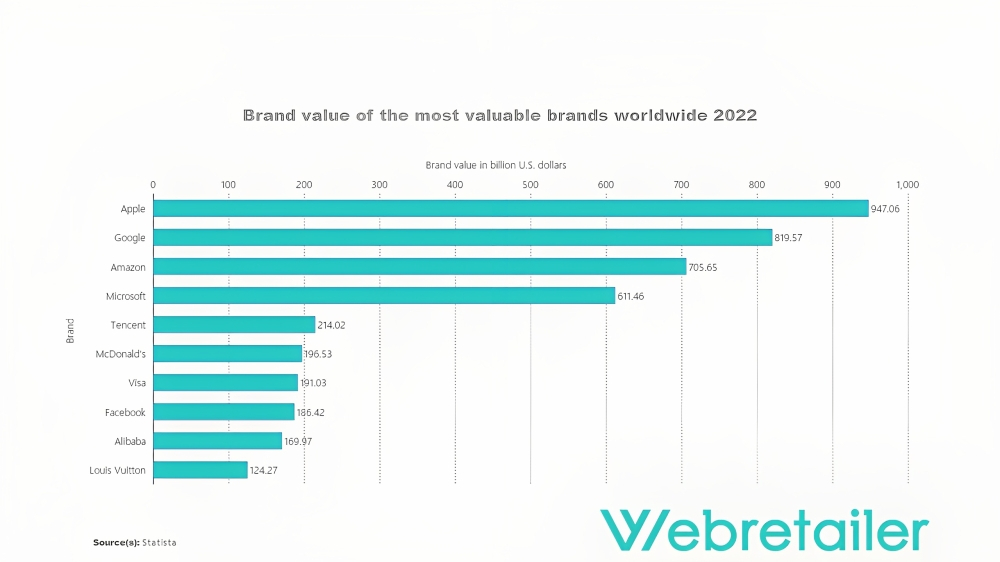
In terms of competing marketplaces, the only competitor that cracked into the top 10 is Alibaba, coming in at number 9. It’s interesting to note that technology-based brands dominate the list, with the likes of Apple, Google, Microsoft, and Tencent all being in the top five. Aside from Amazon that breaks the mold, other notable exceptions include McDonald’s, valued at $196.5 billion, and Louis Vuitton, with a brand value of just above $124 billion.
Amazon Market Cap Value
According to Statista, Amazon has a market cap of over $1 trillion, three times as much as the second-place Alibaba, which caps at $304 billion. This makes the U.S.-based company by far the largest magnet of capital and, therefore, buyers.
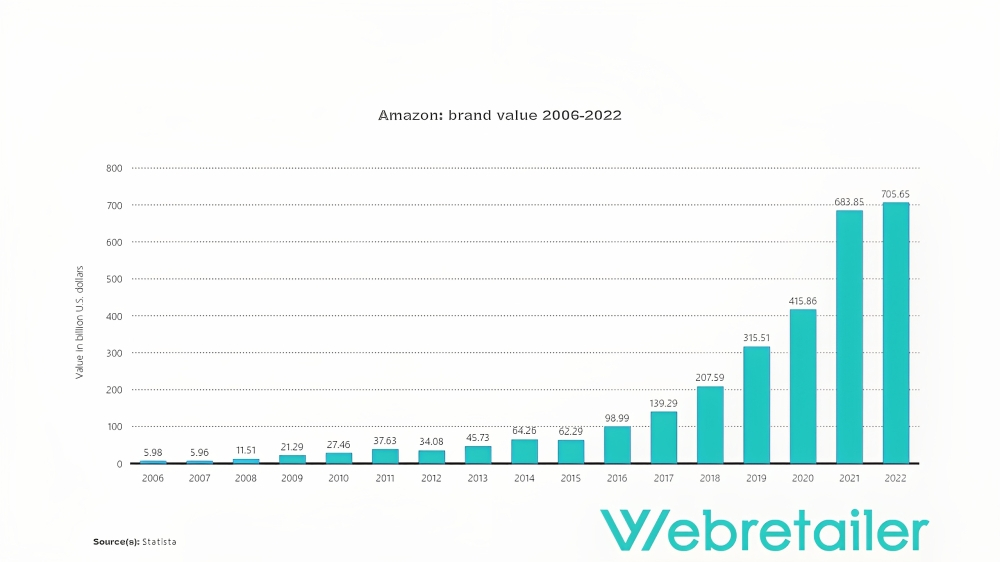
Amazon Brand Value
This probably won’t come as a surprise, but to maintain the top spots in terms of brand value, the value must grow as others catch up. That’s exactly what Amazon does. In 2018, the valuation started picking up steam, and we saw a significant increase in 2021. As of 2022, Amazon’s brand is worth just over $705 billion.
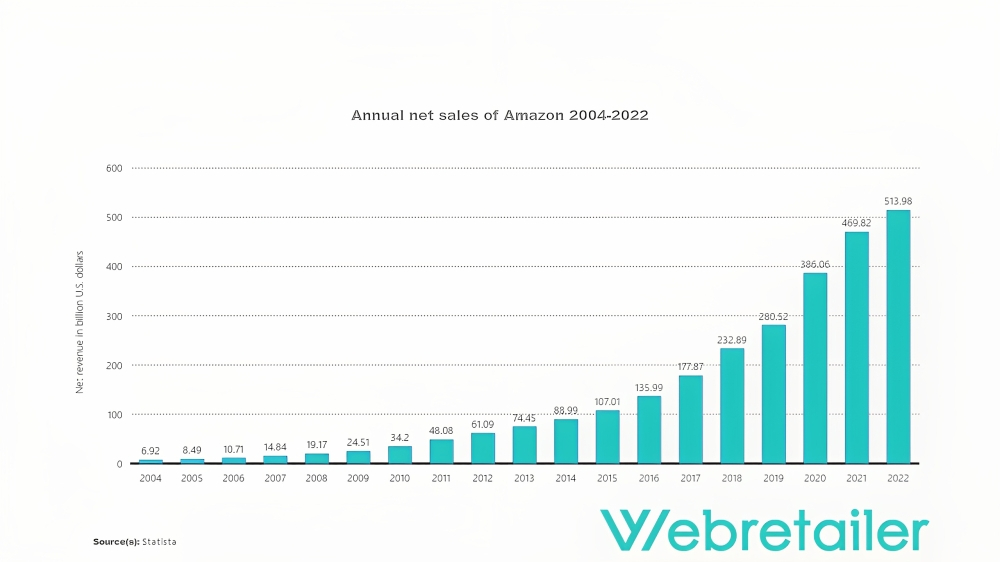
Amazon Sales Statistics
The rise in brand value doesn’t come alone. Sales on the platform are at an all-time high, and they have been rising steadily for years. From 2015 onwards, the net sales rose at a much faster rate than before, peaking at $513.98 billion in 2022.
Additionally, Amazon acquires other businesses to put them under the same company and increase its value that way. Eleven of its acquisitions went for a price of $500 million or more, with the purchase of Whole Foods being its most expensive acquisition at $13.7 billion. Check out their top acquisitions:
| Company Acquired by Amazon | Year of Acquisition | Price |
|---|---|---|
| Whole Foods | 2017 | $13.7 billion |
| Metro-Goldwyn-Mayer | 2021 | $8.45 billion |
| One Medical | 2022 | $3.9 billion |
| Zoox | 2020 | $1.3 billion |
| Zappos | 2009 | $1.2 billion |
| Ring | 2018 | $1.2 billion |
| Pillpack | 2018 | $1 billion |
| Twitch | 2014 | $970 million |
| Kiva Systems | 2012 | $775 million |
| Souq.com | 2017 | $580 million |
| Quidsi | 2011 | $500 million |
MORE: How to sell on Amazon in 2023.
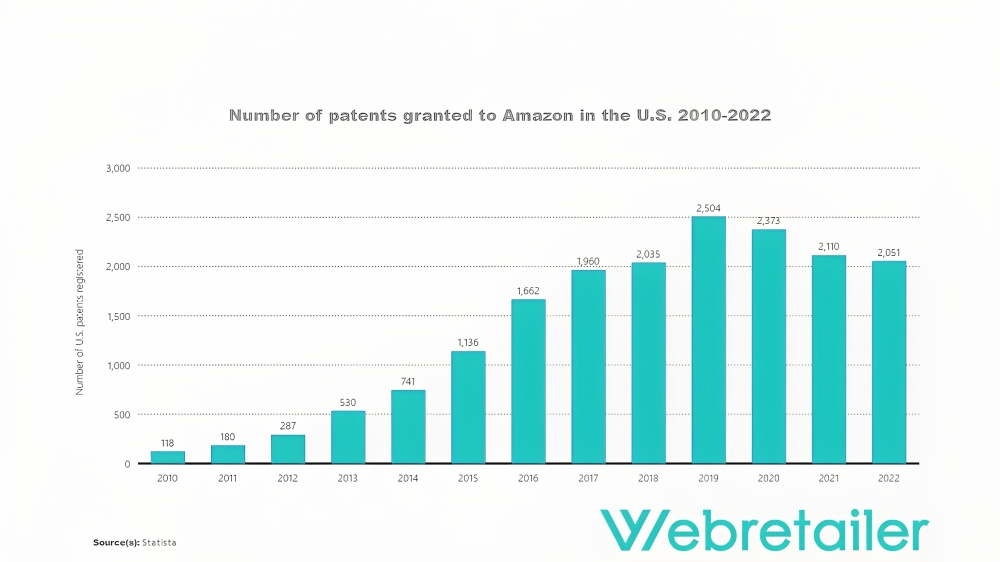
Amazon Takes Out Thousands of Patents Each Year
One of the main aspects of Amazon’s success is its own fulfillment network. Online retailers can partner up with the platform to use their fulfillment facilities and prepare their products for consumers quicker and with less hassle.
However, this is not where Amazon stops. The company creates products itself and places them at the top of search results. One of the stumbling blocks of making it big on Amazon is the fact that the platform, while being a marketplace, is simultaneously your biggest competitor.
The U.S. Patent and Trademark Office (USPTO) granted the company over 2,000 patents in each of the last five years.
Weirdly enough, that doesn’t put it even close to being the company with the most patents granted in the United States. According to Statista, in 2020 and 2021, the list of most assigned patents by company looks like this:
| # | Company | Number of Patents in 2020 | Number of Patents in 2021 |
|---|---|---|---|
| 1 | International Business Machines Corp | 9,130 | 8,682 |
| 2 | Samsung Electronics Co Ltd | 6,415 | 6,366 |
| 3 | Canon Inc | 3,225 | 3,021 |
| 4 | Taiwan Semiconductor Manufacturing Co TSMC Ltd | 2,833 | 2,798 |
| 5 | Huawei Technologies Co Ltd | 2,761 | 2,770 |
| 6 | Intel Corp | 2,867 | 2,615 |
| 7 | Apple Inc | 2,791 | 2,541 |
| 8 | LG Electronics Inc | 2,831 | 2,487 |
| 9 | Microsoft Technology Licensing LLC | 2,905 | 2,418 |
| 10 | Qualcomm Inc | 2,276 | 2,149 |
| 11 | BOE Technology Group Co Ltd | 2,144 | 2,135 |
| 12 | Toyota Motor Corp | 2,079 | 2,028 |
| 13 | Samsung Display Co Ltd | 1,902 | 1,975 |
| 14 | Amazon Technologies Inc | 2,244 | 1,942 |
| 15 | Micron Technology Inc | 1,535 | 1,789 |
| 16 | Sony Corp | 2,239 | 1,683 |
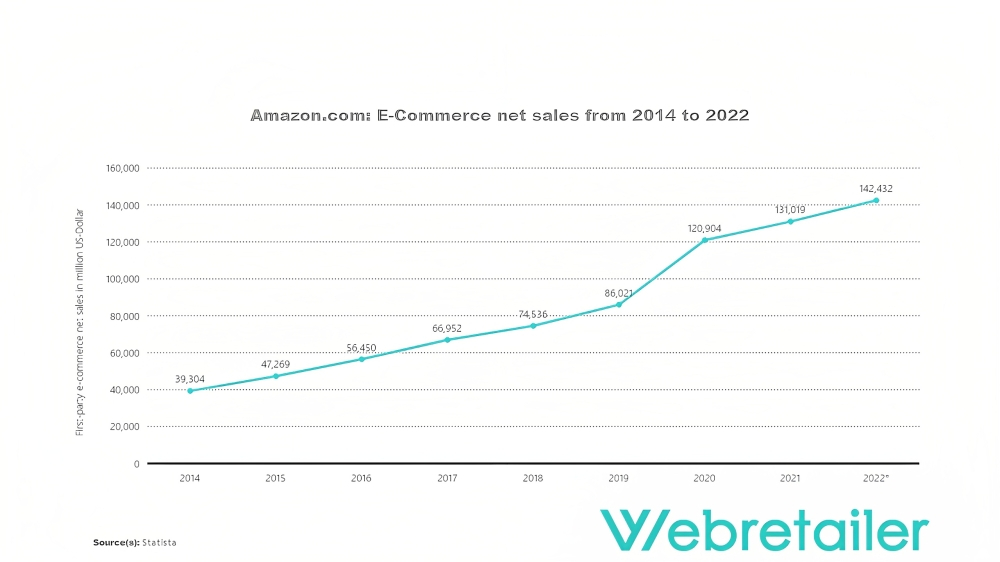
Sales Continue to Grow
In trend with the rise of net sales, e-commerce sales on the platform are also consistently on the rise. In 2020, due to the pandemic, there was a hike in sales. However, once the measures for COVID-19 stopped, people haven’t reduced their newly-grown habit of buying online. In 2021 and 2022, first-party e-commerce sales were around $130 and $140 million.
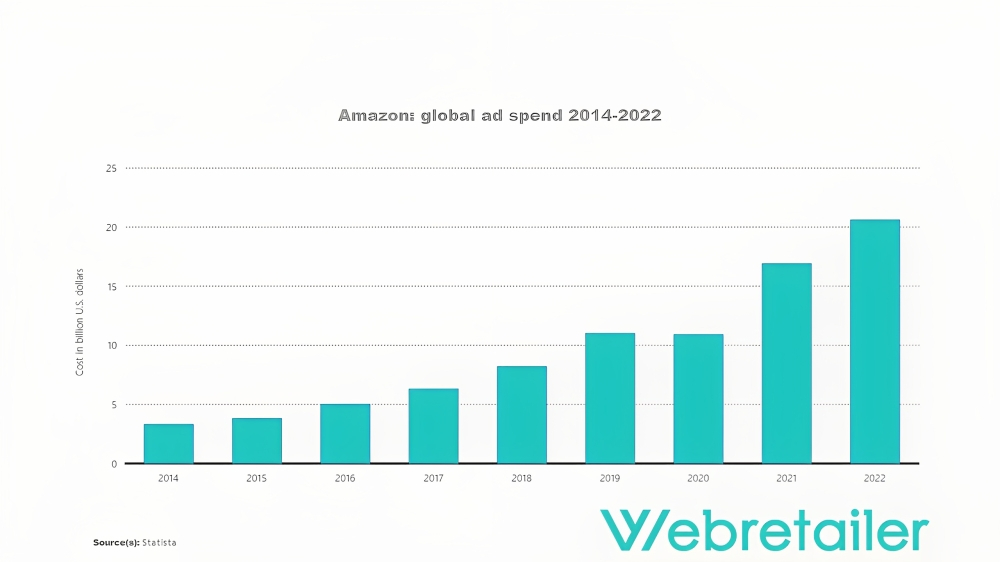
The proof of the importance of Amazon as (one of) the main revenue sources comes from the fact that online retailers see immense value in Amazon ads. Reaching the top of search results on the platform is crucial for growing your customer base, and retailers were quick to notice that.
The global ad spend on the marketplace has also been on a consistent rise, with a slight dip in 2020. The ad spend went from $3.3 billion in 2014 to $20.6 billion in 2022.
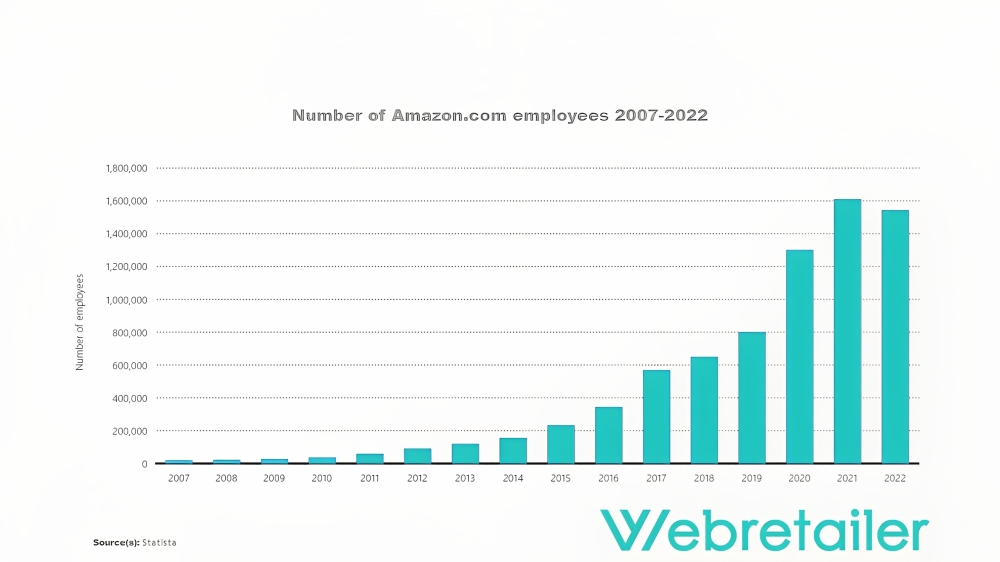
Demand on Amazon Rises While Employee Number Drops
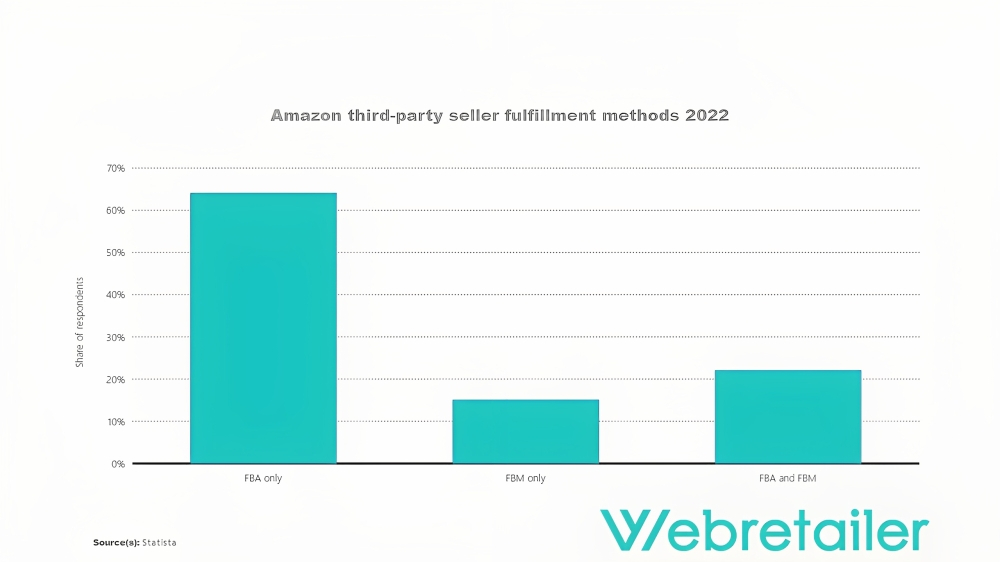
It’s interesting to note that the vast majority of retailers on Amazon choose Fulfillment by Amazon (FBA) to outsource their fulfillment orders to the platform. It’s one of the reasons (aside from the popularity of the marketplace) that retailers love working with Amazon and selling their products via the company.
In fact, according to the latest research, over 60% of third-party sellers use FBA as their fulfillment method only, while another 22% combine FBA and FBM (Fulfilled by Merchant) methods.
MORE: Maximize your profit using FBA calculator.
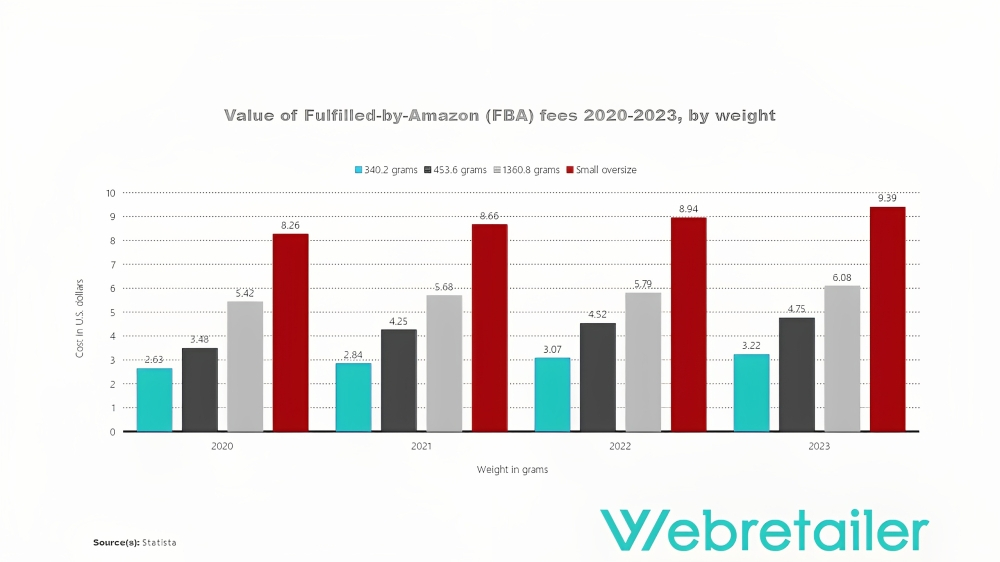
As expected, the company has decided to profit from this trend, and fees for fulfillment services have gone up. While the increase in prices represents millions of additional dollars to Mr. Bezos, as a single seller, you won’t feel too much of the hit. From 2020 to today, the price for a package of, say, up to 340 grams rose by $0.59.
Despite the growth in demand for FBA and creating its own products, Amazon has reduced the number of employees on its payroll. This has come as a result of technological advancements as well as various employee strikes due to low salaries. In any case, the number of Amazon employees went from over 1.6 million in 2021 to 1.54 million the following year.
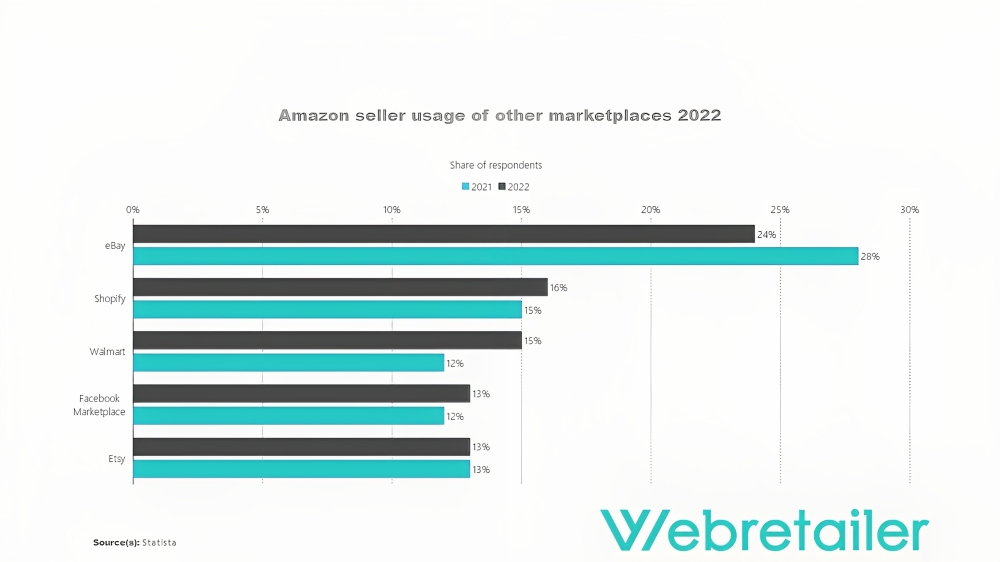
Amazon Competition
So, what are the other top marketplaces you can explore if you don’t want to sell your products on Amazon or you want to create multiple revenue streams?
Among Amazon sellers, eBay and Shopify have proven to be the most popular alternatives, with the percentage of respondents using these platforms being 24% and 16%, respectively. Walmart closely follows Shopify, while Facebook Marketplace and Etsy complete the list of the most popular alternatives.
Need help setting up your eBay store? Check out some of the best eBay tools and services to help you with the process.
What Are Some Interesting Statistics About Amazon?
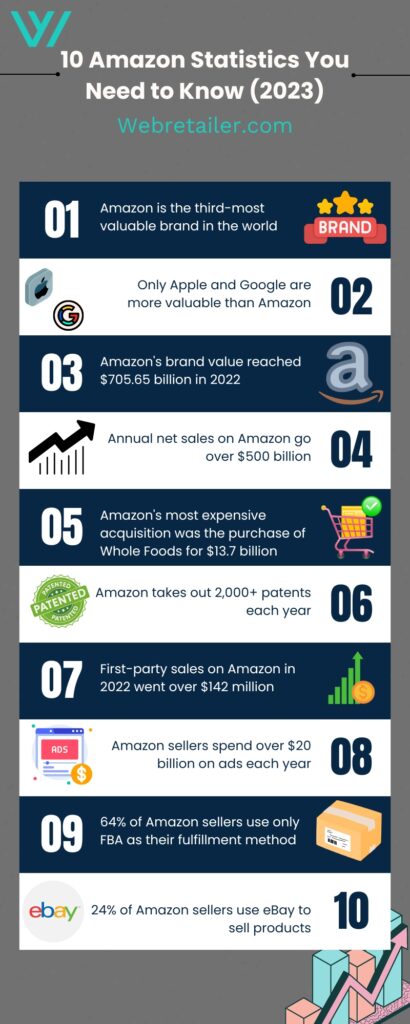
- Amazon is the third-most valuable brand in the world, behind Apple and Google.
- Amazon’s market cap has passed the $1-trillion mark.
- Net sales reached $513.98 billion in 2022.
- Amazon takes out about 2,000 patents each year.
- The global ad spend on Amazon went over $20 billion in 2022.
- 60% of third-party sellers use FBA for fulfillment.
- eBay is the most popular alternative, with 24% of Amazon sellers offering their products on eBay as well.
Takeaway
While the global pandemic expedited the process, e-commerce has always been the most popular way of shopping, and Amazon has always been an inevitable part of the equation. You may strike gold on other platforms, but avoiding selling on Amazon is like driving a bike in a motorcycle race.
Amazon is a well-oiled machine that, despite sometimes hampering sellers, helps retailers reach customers globally and manage their fulfillment process. If you have a personal web store, that doesn’t mean you should neglect Amazon, which is still the most popular marketplace in the world and will remain so in the foreseeable future.
If you want to optimize your efforts and make the most out of your time and money, make sure to check out some of the best Amazon tools and services tailored to the needs of sellers using the marketplace.

Leave a Reply