This post is by Chris Turton, an ecommerce and Amazon consultant based in the UK.
As an Amazon seller you have probably seen the endless number of reports that are available in Seller Central.
There are plenty of reports providing data on your inventory, orders, returns, advertising, tax documents and more, but we are not going to focus on those here. This article is all about finding and using reports which can directly help grow your sales.
So let’s cut through the noise of those countless metrics and options, and get quick actionable insights into your business, using the reports in Amazon Seller Central.
1. Find your best products for Amazon PPC
Amazon Sponsored Products PPC advertising is a great way to drive revenue, but which of your products offer the best opportunity for additional profitable sales?
Usually, products with low views but a high conversion rate are a great prospect for PPC advertising. You can drive additional traffic to product detail pages which you know convert, maximizing the return on your advertising spend.
Here’s how you can use Amazon Seller Central reports to find which products are not being seen very often, but are selling well when people do find them.
First, go to Business Reports, under the main Reports tab in Seller Central.
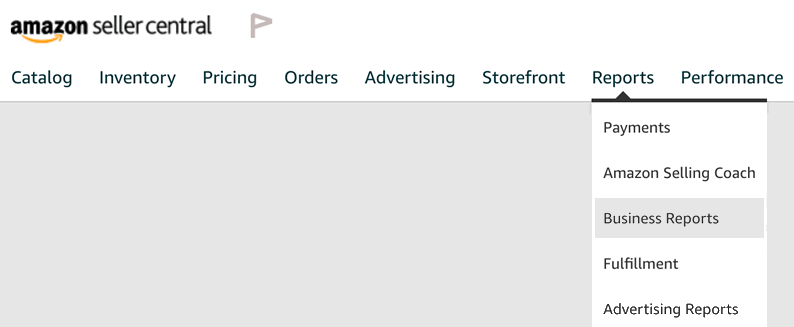
Business Reports cover sales and traffic data from a number of different angles, but they only show products you have sold – not your entire inventory.
The data here might look a bit messy and cumbersome at first, especially if you have a lot of SKUs that are selling, but once you know what to look for it is really quick to get to the point.
We need to drill down into individual products, and the best reports for doing that are the “By ASIN” reports.
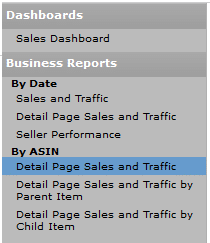
Selecting the right “By ASIN” report
There are three reports to choose from here, and you need to select the right one depending on how your product inventory is structured. Here’s an overview.
- Detail Page Sales and Traffic – this is the most helpful report as everything is shown by product ASIN.
- Detail Page Sales and Traffic by Parent Item – if your business has a lot of variations which are essentially the same product, such as different sizes, this report helps you focus on the product as a whole.
- Detail Page Sales and Traffic by Child Item – if it makes more sense to look at child variations separately, this report will be a better fit for you.
Metrics used in the “By ASIN” reports
Before we get into how to find the best products to promote with Amazon PPC, there are a few standard metrics to understand.
It’s really important to understand what everything means so you are able to interpret the data correctly.
- Sessions – the number of customers who visited this ASIN detail page within the date range you have set.
- Session Percentage – this is one of the most important metrics, showing what percentage of customers who visited the ASIN detail page went on to buy the product from you. A low session percentage typically indicates a product where you are not acquiring the Buy Box or the listing information is poor.
- Page Views/Page Views Percentage – sometimes customers will view a product page more than once and these metrics will reflect that. The Session Percentage is generally more useful.
- Buy Box percentage – how much of the time your product was in the Buy Box over the period.
- Units Ordered – the number of units ordered for this product, just for your selling account and not the entire ASIN (if you share the Buy Box with other sellers).
- Unit Session Percentage – Amazon’s wording for “conversion rate”. This is one of the most crucial metrics in this report, showing how many sessions convert to customers.
- Total Order Items – the number of orders placed for this item. If any customers ordered more than one unit, then this will be lower than the Units Ordered.
Using the report
Let’s take a look at a sample report:
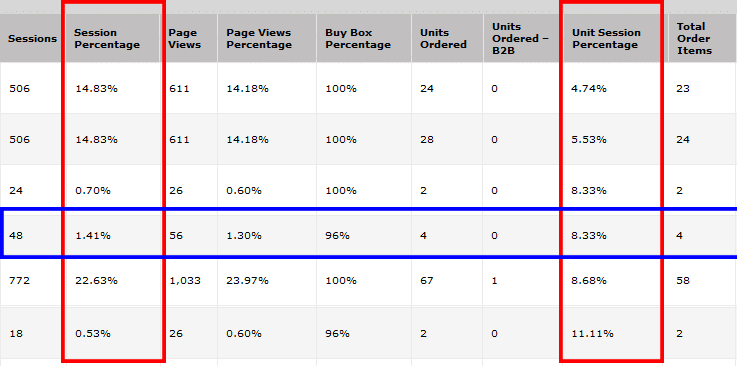
Take a look at the fourth row down, highlighted with a blue box. This shows 48 Sessions, and a Session Percentage of 1.41% – so only 1.41% of customers view this product. However, the Unit Session Percentage is 8.33% which is a solid conversion rate.
A product with a low Session Percentage and a high Unit Session Percentage like this means the product page is good enough to convert, but not enough customers are seeing it.
This is a prime candidate for Sponsored Products advertising and other paid advertising platforms. You will be paying each time customers click through to the product page, but the high conversion rate means that you’ll get the most value out of those clicks.
You could also consider more keyword research to help develop the search ranking of the product.
2. Find products that aren’t converting
At the opposite end of the spectrum are products that generate plenty of views, but very few sales.
You can use the same Business Reports “By ASIN” in Amazon Seller Central to find these products. Just select Unit Session Percentage then click on the white arrow and choose “sort descending” to help find products with a low Unit Session Percentage (conversion rate) but high Sessions.
Here’s an example:
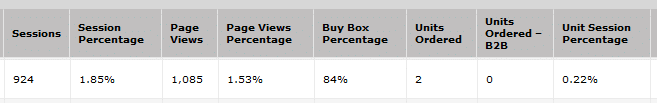
This product has 924 Sessions but only two units have been ordered, which gives a conversion rate of 0.22%.
A low Unit Session Percentage usually means a poor product page, so we should focus on improving the product information to take advantage of the good volume of traffic to this page.
Note that we have an 84% ownership of the Buy Box for this product, so we are competing with other sellers, but perhaps only one. If we don’t have access to edit the product information ourselves, it might be worth contacting the other seller. If they can improve the product page then that will benefit us both.
3. See how your business is doing overall
For this we are going to use Business Reports again, but select from the “By Date” group of reports instead of “By ASIN”.
The big difference with the “By Date” group of reports is that you can create interactive graphs using any of the columns. The date stays on the X axis while the columns you add are charted on the Y axis.
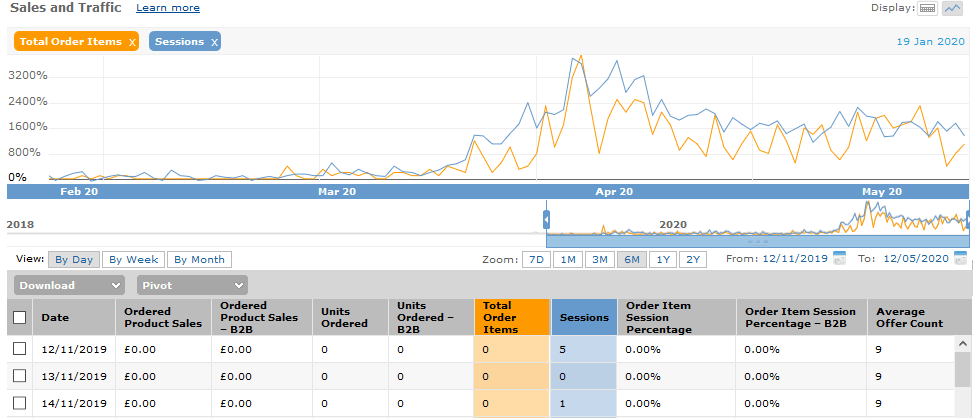
The screenshot above is the Sales and Traffic report. You can right-click on any of the columns to plot them on the graph.
Here’s an overview of the “By Date” Business Reports.
- Sales and Traffic – this is an overview of sales statistics such as total product sales and the total number of units sold. It is ordered by date, which you can set to anything from seven days to two years.
- Detail Page Sales and Traffic – this report looks very similar to the Sales and Traffic report, but gives access to more product-driven metrics such as conversion rate, Buy Box percentage etc
- Seller Performance – this report provides some helpful breakdowns such as refund rates, feedback, A-Z claims etc. Any drastic changes found here should be analyzed to prevent action being taken by Amazon.
The “By Date” reports are useful for providing an overall view of your Amazon sales, and that is valuable, but they do not get into the product-level nuts and bolts of your Amazon seller account. For that, the “By ASIN” reports described above are much more useful.
4. Research keywords using Amazon Search Terms
Amazon Brand Analytics has replaced ARA Premium, a high-end reporting tool for Amazon vendors. It’s only available to sellers enrolled in the Amazon Brand Registry.
Brand Analytics is still in its infancy and some reports are basic, but it does provide some unique information to help brands improve their performance. You can find Brand Analytics on the reports menu in Amazon Seller Central.
The features available in Brand Analytics reports include:
- Finding which search terms are trending on Amazon.
- Seeing how many customers make repeat purchases of your brand.
- Comparing your products against competing products.
Let’s take a look at the Amazon Search Terms report.
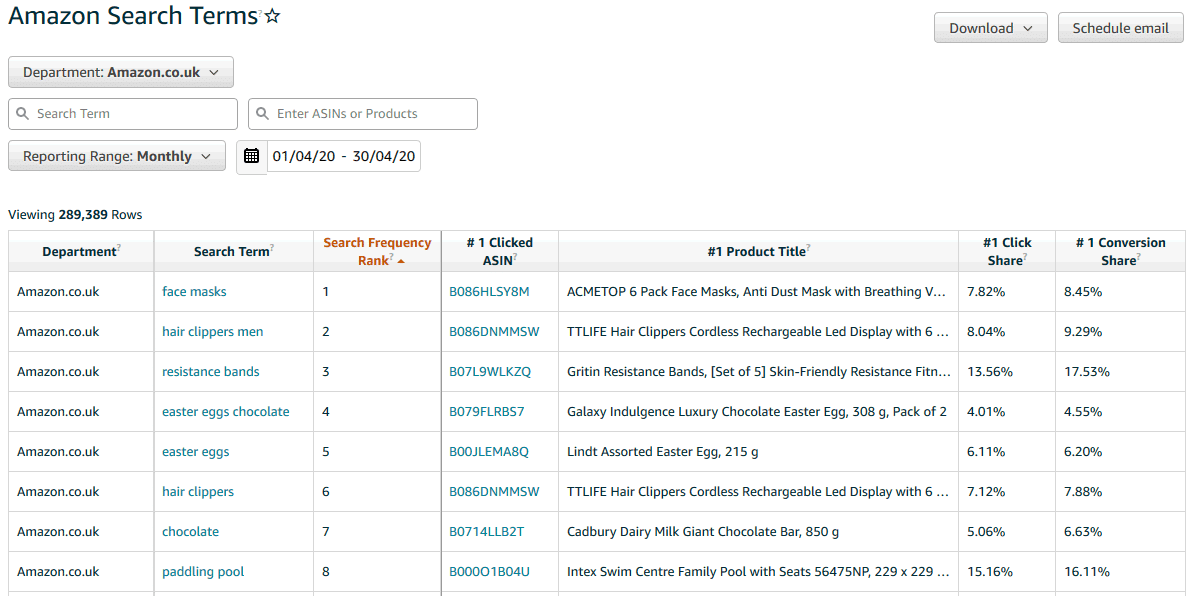
The screenshot above shows the top search terms on Amazon.co.uk and the most-clicked product for each search term.
The Amazon Search Terms report is not as powerful as some third-party tools such as Jungle Scout or Helium 10, but it gives key information on many search terms. It shows the top three products, with their share of clicks and conversions.
You can also enter an ASIN to see what search terms that product shows for, which can be helpful with competitor research. You can implement those search terms in your own ASINs, work out which competing products are converting the best, and use that knowledge to improve your listings.
Metrics used in the Amazon Search Terms report
The data available in the Amazon Search Terms report is different to the Business Reports covered above, and even the terminology used differs.
Here’s a summary:
- Department – which Amazon marketplace country this search term is from.
- Search Term – the search keywords entered by the customer.
- Search Frequency Rank – how popular this search term is. A rank of one indicates the most popular search term, which is usually much more competitive than lower-ranked terms.
- #1 Clicked ASIN – the most clicked product for this search term.
- #1 Click Share – the percentage of search clicks that this product (the #1 Clicked ASIN) received compared to all products for this search term.
- #1 Conversion Share – the percentage of customers who purchased this product compared to all products purchased after entering this search term.
5. Improve your products with comparison reports
Another Brand Analytics report available in Amazon Seller Central is the Item Comparison and Alternative Purchase Behavior report.
You can use this report to find competing products and research how to improve your own product.
Item Comparison report
Here’s an example of the Item Comparison report. ASINs and product titles have been blurred to maintain privacy of the brand’s data.
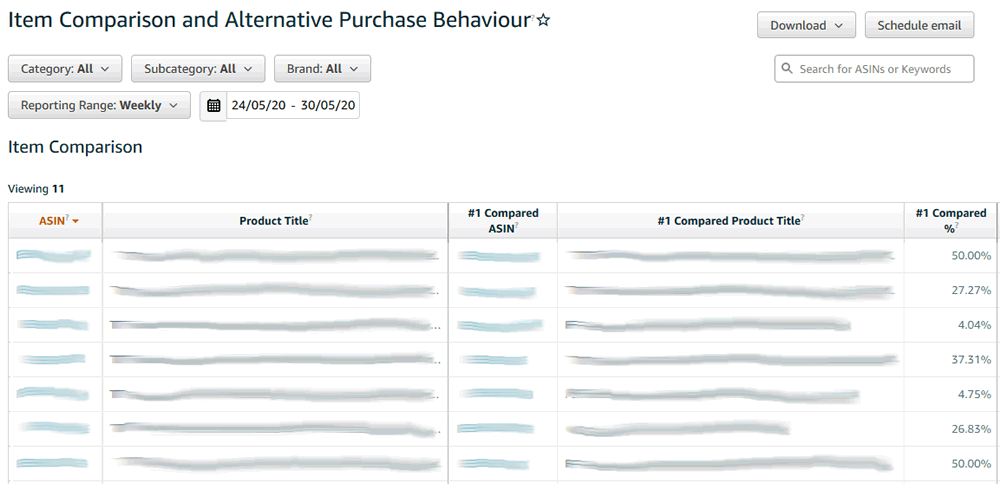
The report shows customers who viewed your product and then viewed another product, and went on to purchase your competitor’s product within the same day.
This gives a good insight into how many customers are looking at your competitors’ products. If your products are seen as interchangeable, how can you get an edge?
Alternative Purchase report
The Alternative Purchase report is shown separately from Item Comparison, and can be quite powerful.
It shows your brands’ ASINs and then up to five products sold by rivals. If you study the products that customers are viewing, you can develop your own product pages to compete against them more effectively.
Watch out for irrelevant data – occasionally products are listed that have nothing to do with your brand or product.
Metrics used in the Item Comparison and Alternative Purchase reports
- ASIN – your product’s unique Amazon product ID.
- #1 Compared ASIN – your competitor’s ASIN.
- #1 Compared % – the percentage of times that this product was viewed by customers who viewed your product within the same day.
- #1 Purchased ASIN – the ASIN of the most frequently purchased product by customers who viewed your product but then purchased another.
- #1 Purchased % – the percentage of customers who purchased this product instead of yours.
Go to the source
Amazon’s reports have come a long way in recent years, and there’s still plenty of room for improvement.
Third-party analytics and product research tools are available and can provide some useful insights, but it’s definitely worth exploring Amazon’s reports first.
Not only are they included in your monthly subscription, but the data comes straight from the source. Amazon’s own data should be 100% accurate, and they will always have information that third-party providers are unable to access.
Which Amazon Seller Central reports do you find the most useful?
This post was by Chris Turton, an ecommerce and Amazon consultant based in the UK.
Chris provides services to businesses worldwide, including ecommerce strategies, pricing and data analysis; eBay and Amazon listings and marketing; SEO, PPC and digital marketing; and Magento web design and development.

What is the difference between Session Percentage and Unit Session Percentage?